
Learn your three tools in about 30 minutes.
Most people add Valhalla to a chart and start guessing. This short course shows you what every line, label and number means, one tool at a time, with live charts you can play with. No videos to sit through, no jargon left unexplained.
Valhalla Indicator
Ready-made strategies for specific markets and timeframes. Pick one, match your chart, then follow the entry, targets and stop it draws for you.
2Valhalla SMC
Market structure made visual: trend shifts, pullbacks, order blocks and setups graded A, B or C so you know which ones deserve your attention.
3Valhalla Scalper
Fast snap-back entries that only follow the trend, with liquidity levels showing you exactly where to take profit.
Three rules that apply to every Valhalla tool
Your progress saves automatically in this browser. Valhalla tools are for education and analysis. Past results, including the backtest statistics shown inside the indicators, don't guarantee future results. All charts in this course run on generated demo data.
Add Valhalla to your chart
You only do this once. Watch the clicks below, then repeat them on your own TradingView. The same steps work for Valhalla SMC and Valhalla Scalper when you get to those modules.
#0A0D33). Valhalla colors the candles white and blue on its own.Pick a strategy, then match your chart
Valhalla Indicator isn't one setting for everything. Each strategy in the Strategy menu (the very first setting) is tuned for one market and a few timeframes. Your chart has to show that same market on one of those timeframes, or the levels and numbers won't mean what they should.
How to read a strategy name
BTCUSDT.P: the exact ticker to open. ".P" is the perpetual contract.
Binance: the exchange or data source to pick in the symbol search.
1m, 5m, 15m, 1h: the chart timeframes this strategy was tuned for.
See the next entry before it happens
This is what makes Valhalla different. The moment you add it to a chart, you see whether a position is open right now and exactly where the next long or short would start. No waiting for an alert, no chasing the move: you get prepared.
Next entry labels
A green "Long at" and/or a red "Short at" label with a cross marks the price where the next position would open. While a short is open you see "Long at", and while a long is open you see "Short at".
The Helper Panel
Settings ⚙ → Visual Settings → Panel: Helper Panel. It shows the current position and the next position: its direction, entry, TP1, TP2, TP3 and SL.
Orders in place
With the next entry, targets and stop in hand, you can place a stop market order at the entry (buy stop at "Long at", sell stop at "Short at") with TP and SL attached. You're in when price gets there, without waiting for it to trigger.
Read a position on the chart
Everything Valhalla Indicator draws has one job. Tap the numbered dots on the chart, or use the buttons below it.
How targets and stops relate
Every position comes with a plan: an entry, three targets and a stop. Here's how to read the relationship between them, using the same settings you'll find in the indicator.
- The "Long at" and "Short at" labels show where the next position would open. When price reaches one of them, a position opens there.
- The distance between those two levels when the position opens is the range of the position.
- The three targets sit beyond the entry at a multiple of that range. Each strategy comes with its own distances, so you don't need to set anything.
- The stop starts at a share of the range (the Mid-Range Value setting, 50% by default). As new levels form, it moves in your favor. It only ever tightens.
Check the numbers before you act
The Statistics panel replays the selected strategy over every candle your TradingView plan loads and shows you how each target performed. It's off by default. Turn it on here:
The Performance Grade
Follow it
The strategy has performed well on this market and timeframe.
Follow it
Good enough to use. Keep an eye on the numbers over time.
Skip it
Try another strategy on this market, or another market for this strategy.
Which target fits you?
Frequent wins
Highest hit rate, smallest reward per position. Feels rewarding day to day. Good if you like to bank quickly.
The sweet spot
Balances accuracy and reward. The most robust profile for most people who want steady, smooth execution.
Bigger moves
Lower hit rate, higher reward and usually the best expectancy. Suits disciplined or automated setups that can sit through losing streaks.
The settings that matter
You can leave almost everything on default. Click any setting below to see what it does and when to touch it.
Helper Panel vs Statistics panel
Helper Panel shows the selected strategy, its Performance Grade, the current position (direction, entry, TP1–TP3, stop, with ✅ on targets already reached) and the next position's details, marked "subject to change". Statistics shows the backtest. Switch between them any time; many members check Statistics once, then keep the Helper Panel on.
Experiment with settings, then check the numbers
Every strategy comes ready to use, but you're free to tweak it to fit your style. Small changes can move the results a lot, in either direction. So the rule is simple: change one thing, then check the Statistics panel on the same symbol and timeframe.
Let winners run, sometimes
On this market, holding until the opposite entry (B) meant fewer positions but a higher reward per win, and the best TP3 net profit of the three.
Win rate isn't everything
Turning off the Mid-Range stop (C) pushed accuracy up to 88%, yet the reward per win shrank and the grade dropped to ⚠️ Risky. Always read the whole panel.
Every market is different
What works on gold 5m may not work on another market or timeframe. Test each change where you'll actually use it, and click Defaults → Reset settings to go back any time.
Let alerts do the watching
You don't need to stare at the chart. Valhalla has three alert types, and one TradingView alert covers all of them.
A position opened
Fires when a new position starts. The message includes the entry, all three targets with their accuracy, the stop and the strategy's stats.
A level moved
Fires when Valhalla adjusts the next entry. Remember, that level is also the dynamic stop of your current position.
Price is getting close
Fires when price comes within a set distance of the next entry (0.5% by default), so you can prepare before it happens.
Set it up in 4 steps
- Open the chart that matches your strategy (same symbol, same timeframe).
- In the indicator settings, under Main Alerts Settings, keep the three alert types on (they're on by default).
- Open TradingView's alert window: the ⏰ icon in the top bar, or Alt + A.
- Condition: Valhalla Indicator → Any alert() function call. Choose how you want to be notified, then click Create.
One alert per chart. Want alerts on three strategies? Set three alerts, each on its own chart.
What an alert looks like
Checkpoint: Valhalla Indicator
Five quick questions. Get them all right to complete the module. Wrong answers just show you why; try again as often as you like.
Structure first: swings, BOS and CHOCH
Valhalla SMC reads market structure the way an experienced chartist would. Then it builds everything else on top of it: the trend band, the labels, the order blocks and the grades. Step through the basics.
The trend continues
Price breaks the last swing in the direction of the trend. Uptrend breaks a high, downtrend breaks a low. Valhalla draws a thin cyan or red line labeled BOS.
The trend shifts
Price breaks the last swing against the trend. That's the first sign the other side has taken over. Valhalla draws a gold line labeled CHOCH, and this is where BULL and BEAR labels appear.
Time Horizon: the one setting worth experimenting with
Time Horizon decides how big a swing has to be before it counts. Change it and the structure changes, so every label on the chart changes with it. Drag the slider and watch.
Same gold chart, two Time Horizons
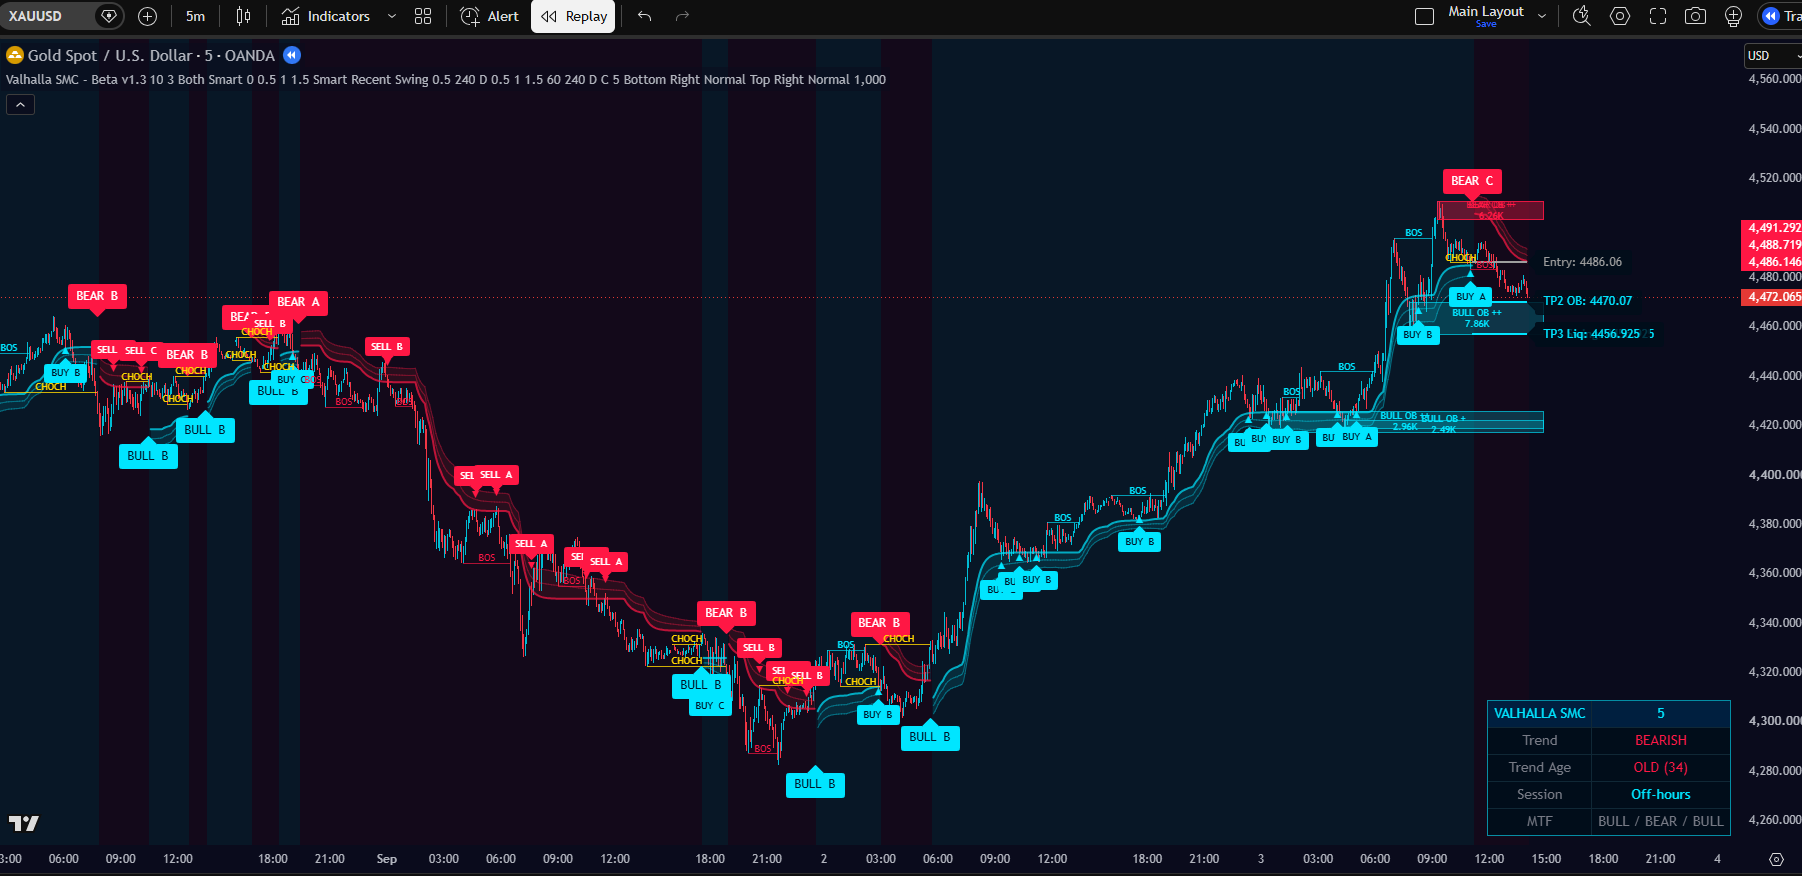
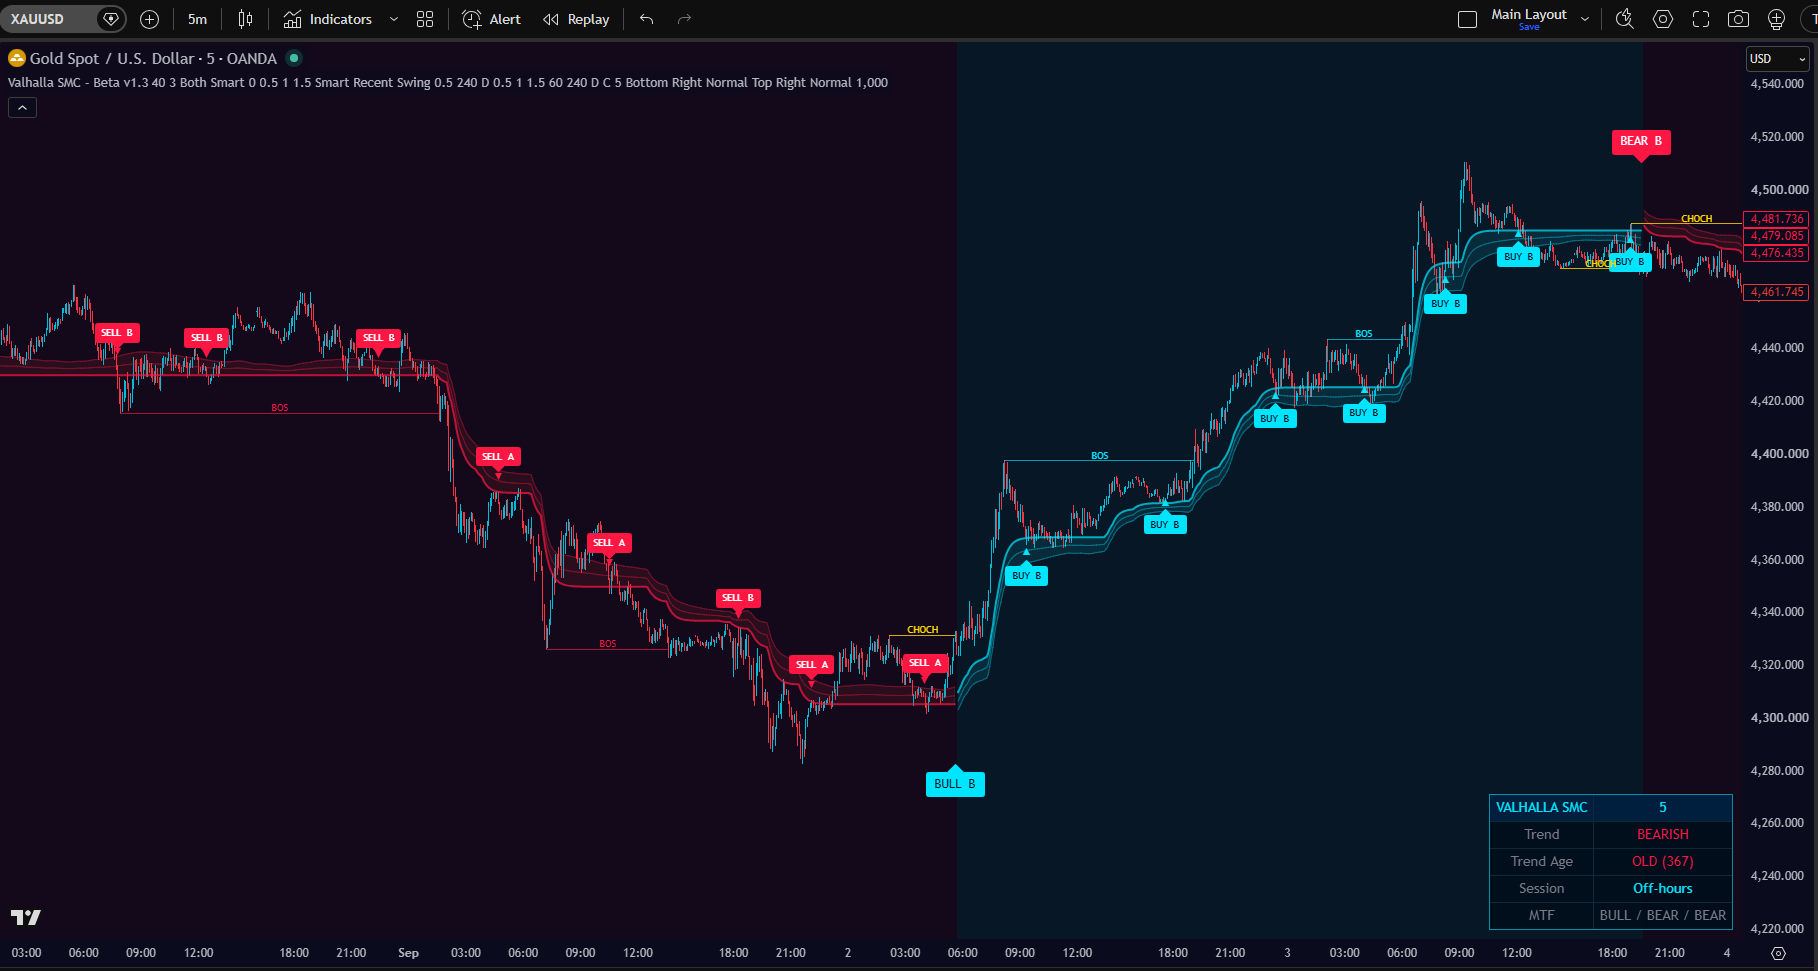
ATR Multiplier: the other key setting
Time Horizon shapes the structure. The ATR Multiplier shapes the trend band, and the band is where the BUY / SELL pullback labels come from. Change it and you change which pullbacks count, so it's worth experimenting with just as much.
Same gold chart, two band distances
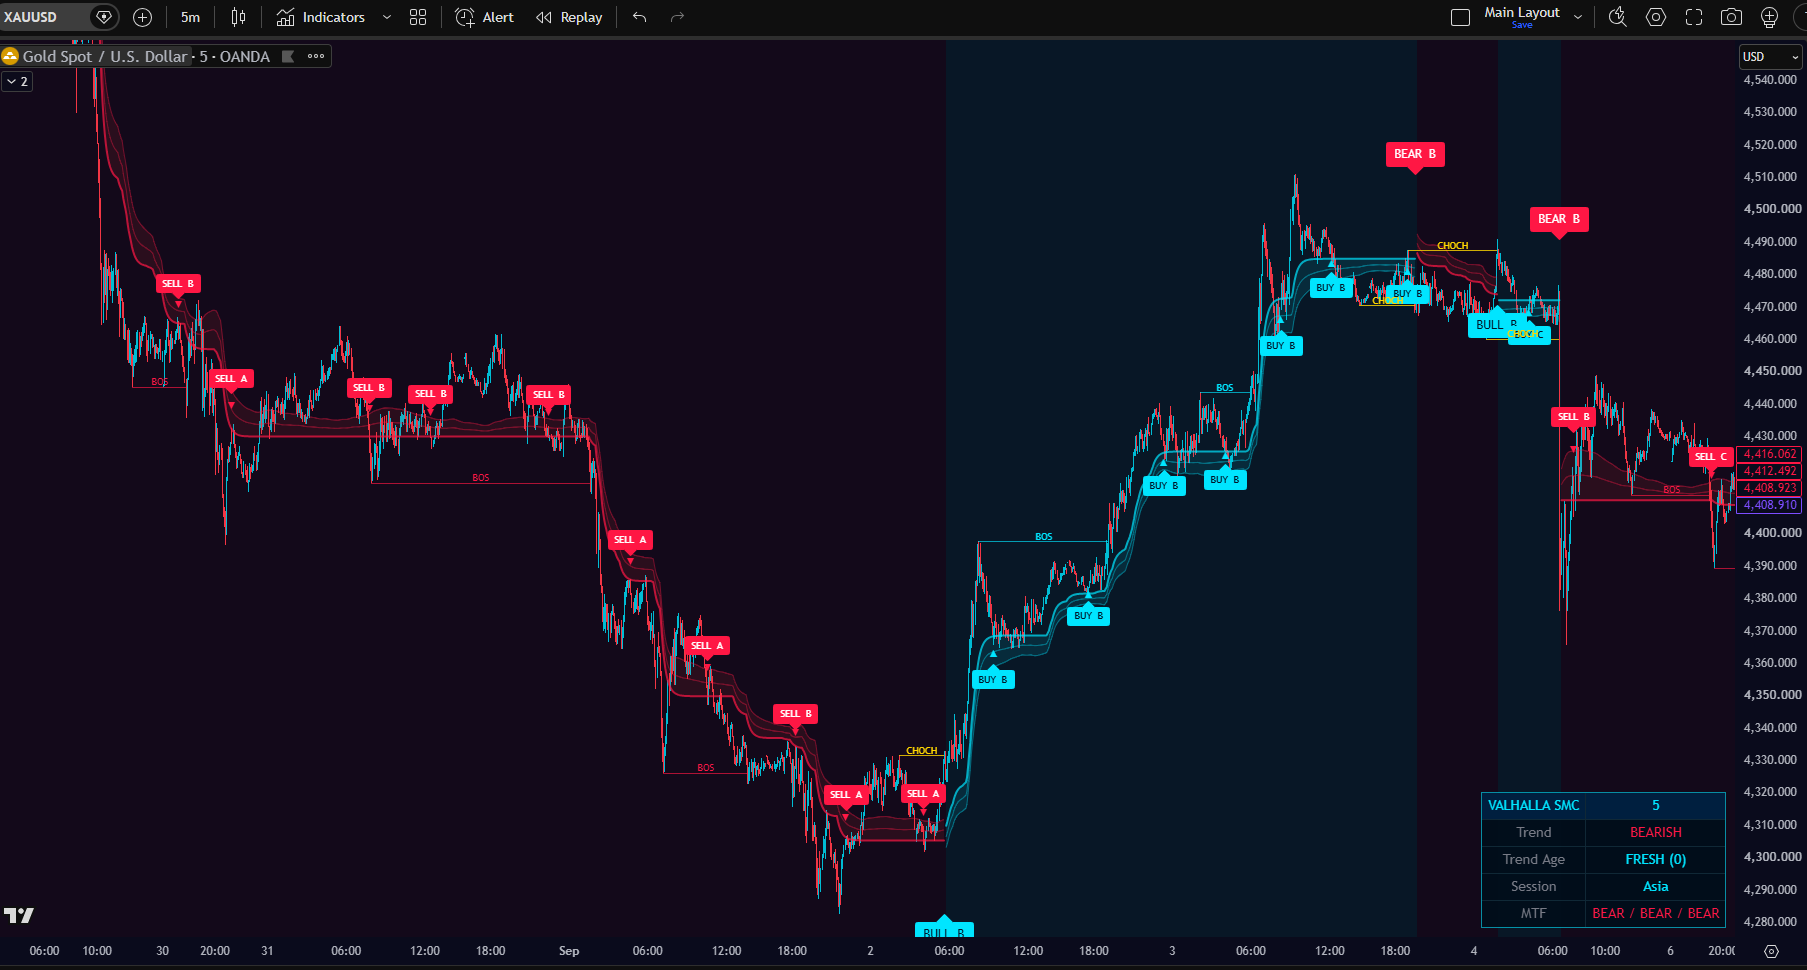
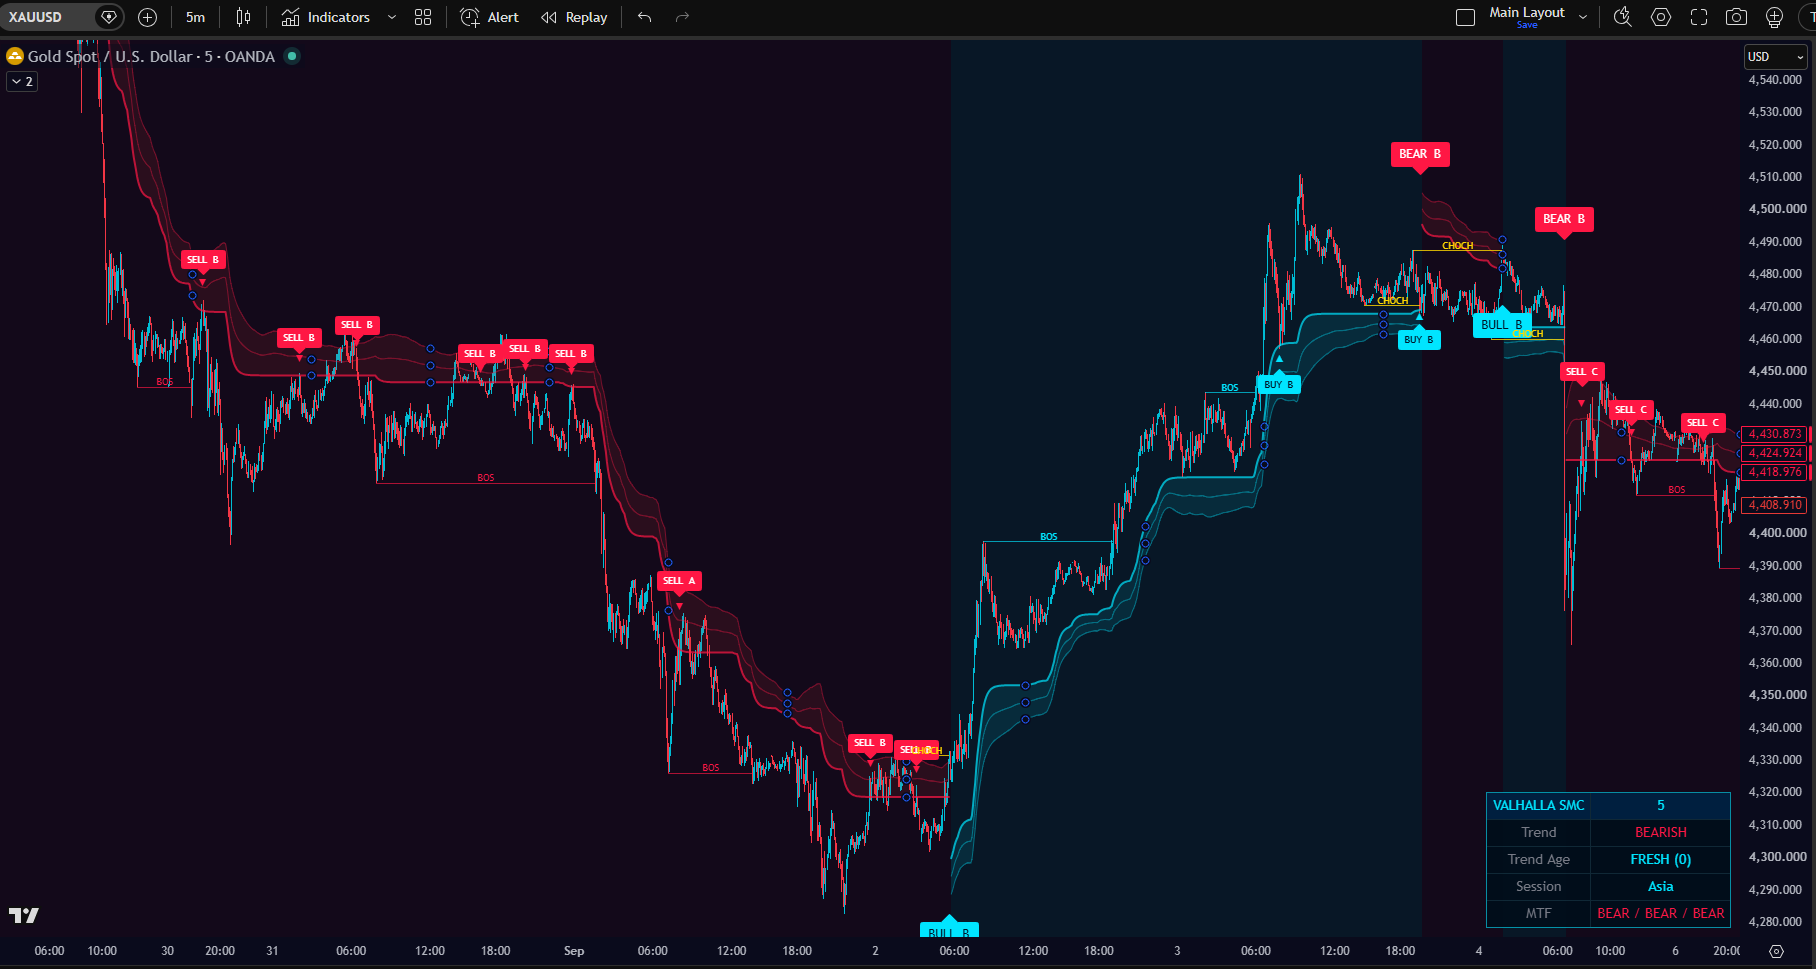
More pullback labels
The band sits close to price. Shallow pullbacks reach it, so BUY/SELL labels print more often, with more noise.
Balanced
A good starting point on most markets and timeframes.
Fewer, deeper pullbacks
The band sits further away. Only deeper pullbacks reach it, so you get fewer, more selective BUY/SELL labels.
Read the SMC chart
There's a lot on screen, but each piece answers one question. Tap the numbered dots.
Candle colors at a glance
Orange and purple candles mean price is testing the trend band. That's where pullback entries (BUY/SELL) tend to form.
A, B, C: focus on the strongest setups
Every BULL, BEAR, BUY and SELL label carries a letter. A = high conviction, B = standard, C = low conviction. You don't need to act on every label. The grade tells you which ones deserve your attention.
High conviction
The ones to focus on. Many members only act on A labels.
Standard
Worth considering, especially alongside your own read of the chart.
Low conviction
Shown by default so you see the full picture. Hide them with the setting above.
Targets and stops
When a new label prints, Valhalla SMC draws the plan: a grey entry line and up to three targets, extended to the right until the next label replaces them.
Nearest swing
The closest swing beyond your entry. For pullback entries, it's the swing where the pullback started.
Nearest opposing order block
The edge of the closest order block on the other side, where opposing orders sit.
Higher-timeframe liquidity
The nearest previous 4-hour or daily high or low that price hasn't taken yet.
Settings and alerts
Defaults are solid. Time Horizon is the one to experiment with; the rest is mostly about what you want to see.
Alerts: pick each one by name
Valhalla SMC alerts are separate conditions. Open the alert window (Alt + A), choose Valhalla SMC, then pick one condition per alert:
Tip: start with BULL and BEAR. They're the structure-shift entries.
Checkpoint: Valhalla SMC
Five questions to lock it in.
Stretch, then snap back
The Scalper works on one simple idea: when price stretches too far from its average, it tends to snap back. Valhalla measures that stretch in three zones and only shows entries in the direction of the trend.
The trend ribbon picks your side
The colored ribbon is the first thing to look at. Price above it (green) means only buy entries are shown. Price below it (red) means only sells. You never fight the trend, and a big chunk of the noise disappears.
EMA 200 by default
Works well for most setups. You can switch to SMA, VWAP, Hull (HMA) or Double EMA (DEMA). For HMA and DEMA, a length around 100 is a good start.
Use a higher timeframe for the trend
Leave Trend Filter Timeframe blank to use your chart's timeframe, or set it higher. Scalping the 5m? Set the trend to 1 hour (or 30 minutes) so every entry lines up with the bigger picture.
Ribbon Width only changes how thick the ribbon looks. It doesn't change any entry.
Circles, triangles, diamonds
Three shapes, three zones. The further price stretches, the bigger the shape and the stronger the expected snap-back.
Most frequent
Fires when price touches the inner zone. For experienced scalpers who want to catch almost every bounce. On by default.
Start here
Price pushed further but lacked the momentum for the outer zone. The sweet spot for most people. On by default.
Big stretch
A strong deviation from the average with the highest odds of a snap-back. If price breaks through instead, it can mark a trend change. Off by default.
Liquidity levels are your exit
The yellow lines are the previous daily (solid, thicker) and 4-hour (dashed) highs and lows. Lots of orders sit there, so price tends to travel to them. A level disappears once price moves through it.
Recommended settings and alerts
Keep it simple. Here's the setup we recommend for getting started, and how to make the Scalper alert you.
Tier 1 and 2 on (default). Turn on Tier 3 for the big stretches, which are less frequent.
On, EMA, length 200. On low timeframes, set Trend Filter Timeframe to 30m or 1h. Keep the ribbon visible.
Both slots on: daily and 4-hour. Lower the second slot (1h, 15m) on lower chart timeframes.
Turn on the tiers you use plus Liquidity TP Alerts, then create one alert with "Any alert() function call".
Checkpoint: Valhalla Scalper
Last checkpoint. You've got this.
You're ready.
You now know more about Valhalla than most members who've had it for months. Keep this cheat sheet handy for your first week.
Your Valhalla cheat sheet
Valhalla Indicator
- Strategy first: same symbol, same timeframe.
- Panel → Statistics. Follow 👍 Solid or 🔥 Strong only.
- Panel → Helper Panel: next entry, TPs and SL before it opens (they can adjust).
- Cyan = entry, green = TP1–TP3, red = stop that only tightens.
- "Long at" / "Short at" = next entry, and your current stop.
- Pick your target: TP1 frequent, TP2 balanced, TP3 bigger.
- Alert: Any alert() function call, one per chart.
Valhalla SMC
- CHOCH = trend shift (BULL/BEAR). BOS = trend continues.
- BUY/SELL = pullback to the band after a CHOCH.
- Focus on A and B grades first.
- Time Horizon: 10 for shorter trends, try 40 for longer ones.
- ATR Multiplier: 3 default. Lower = more pullback labels, higher = fewer, deeper ones.
- Targets: TP1 Swing, TP2 OB, TP3 Liq. Invalidation = the CHOCH swing.
- Alerts: pick BULL / BEAR conditions by name.
Valhalla Scalper
- Ribbon green = buys only. Red = sells only.
- Trend timeframe higher than your chart (e.g. 1h on 5m).
- Triangles first, then add circles. Diamonds = big stretch.
- Take profit at the 🎯 Liquidity Target.
- Stop at 1:1 of the target distance.
- Turn on Scalper Alerts + Liquidity TP Alerts.
Full documentation ↗
Every setting and strategy in detail.
TelegramAnnouncements ↗
Updates, new strategies and tips.
SupportAsk a human ↗
Stuck on a setting? Message us any time.
Want to go through it again? Reset my progress.